Ep. 210 – May Market update: How the Upper Quartile is Driving Market Movements, Why Affordability is Relative, Generational Shifts & the Boomer Effect, and the R Word – Recession
Ep. 210 – May Market update: How the Upper Quartile is Driving Market Movements, Why Affordability is Relative, Generational Shifts & the Boomer Effect, and the R Word – Recession
Mike kicks off our market update with Sydney – up by 5% for the quarter. While this big city does a lot of heavy lifting when it comes to median figures, Cate points out that every single capital city is recording positive median price movement for the month of May. Dave brings our attention to the pace of growth for the city markets over the short term, as we see these markets gain pace over the regional markets as they play catch up.

Dave also chats about the breakdown of the market segments, specifically pointing out the relative volatility of the top quartile of the market. As history has shown us, the highest priced properties are often the first to tumble in downturn and the fastest to rebound in a recovery.
An intriguing fact that the Trio discuss as media headlines focus on the mortgage holders’ pain is the cohort who are paying cash for their purchases. Whether they be down-sizers or those who have inherited wealth, many purchases are actually settled without the need for lending.
First home buyer participation rates are another side-topic of conversation for the duo and Dave notes some of the grants, opportunities, initiatives and changes that give today’s FHB’s some significantly higher benefits than in previous years.
“The bank of Mum and Dad’s average assistance is over $50,000 nowadays,” says Dave about an article he read recently.
Dave points out the distortion caused within the median values data when it comes to houses and units. Taking two very different cities into consideration (ie. Melbourne and Brisbane) is a case in point when we consider the ratio of units to houses. And Cate raises another data-distortion consideration; what happens when we have an overrepresentation of sales from one particular segment of the market? Mike reminds us about the impact of initiatives that favour particular price-points too. We need to remember that data analysis sometimes needs to be drilled much deeper.
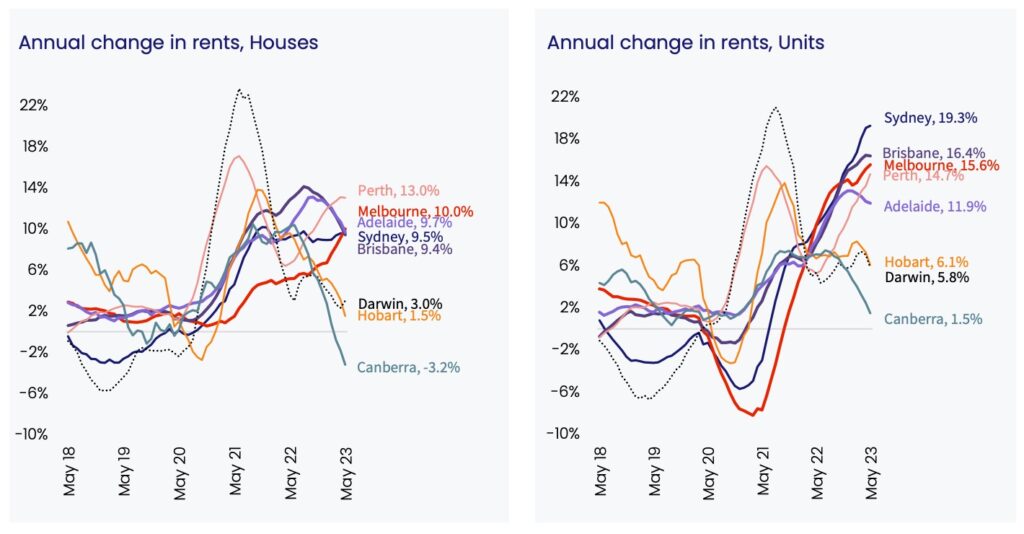
Dave reports the rental movement for capital cities and regions. Capitals are still experiencing pressure and new arrivals will be amplifying this impact. Regions are slowing down, and as Dave explains, only about 15% of new arrivals head to the regions, with the vast majority heading to the capital cities.
Units rents are rising much faster than houses and an obvious reason for this is affordability; units are simply cheaper to rent.

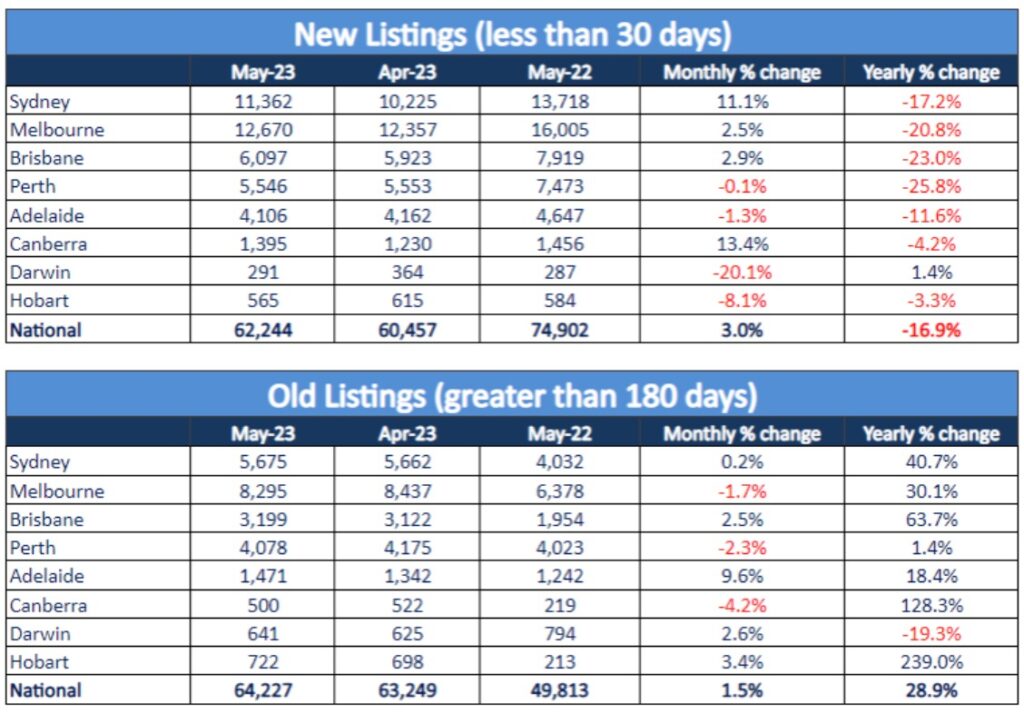
Listings are well under the five year average. Mike questions Cate about the slight uptick in May, but Cate is quick to put it down to Easter school holidays avoidance. There are no signs of reprieve for buyers who are experiencing the impact of stock shortage, unfortunately.
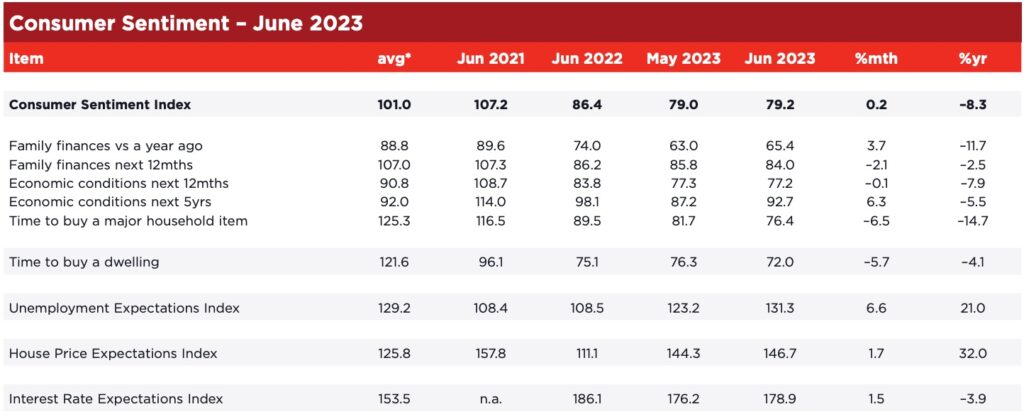
House price expectations have increased; indicating that people are expecting house prices to rise. Key changes include ‘time to buy a major household item’, ‘economic conditions over the next five years’, and ‘time to buy a dwelling’. Mike delves into this last one; it seems a strange contradiction, but as Cate points out, this measure wasn’t much different a year ago. Even in the crazy pace of 2021, this figure still sat below 100 which suggests that the broad consensus is that it’s not a good time to buy a dwelling. People are pessimists!
Dave’s pet subject… lending! “But we’re not lending anymore”, says Mike. Dave unpacks these loan commitment figures and hints that investors may be turning a corner.
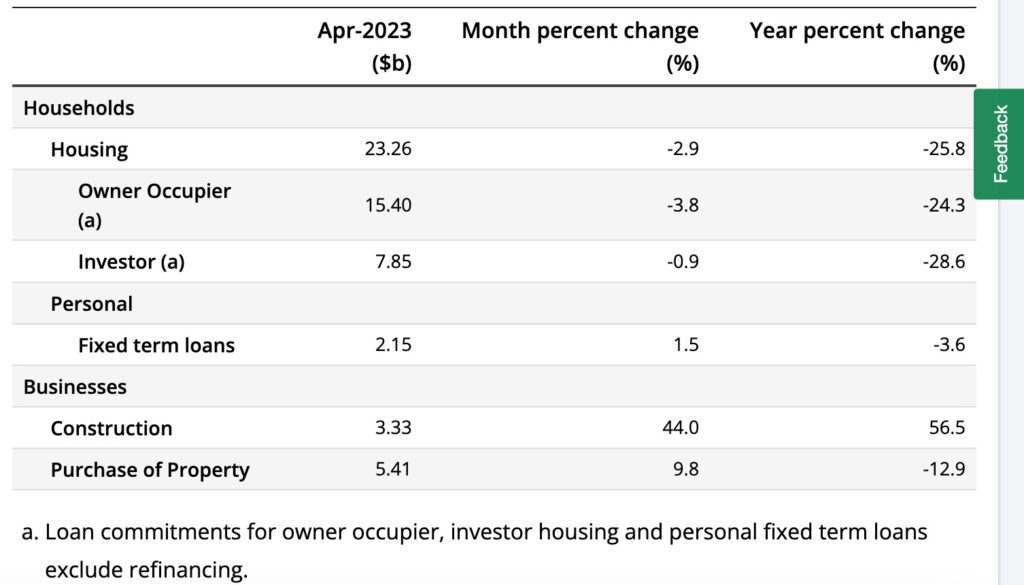
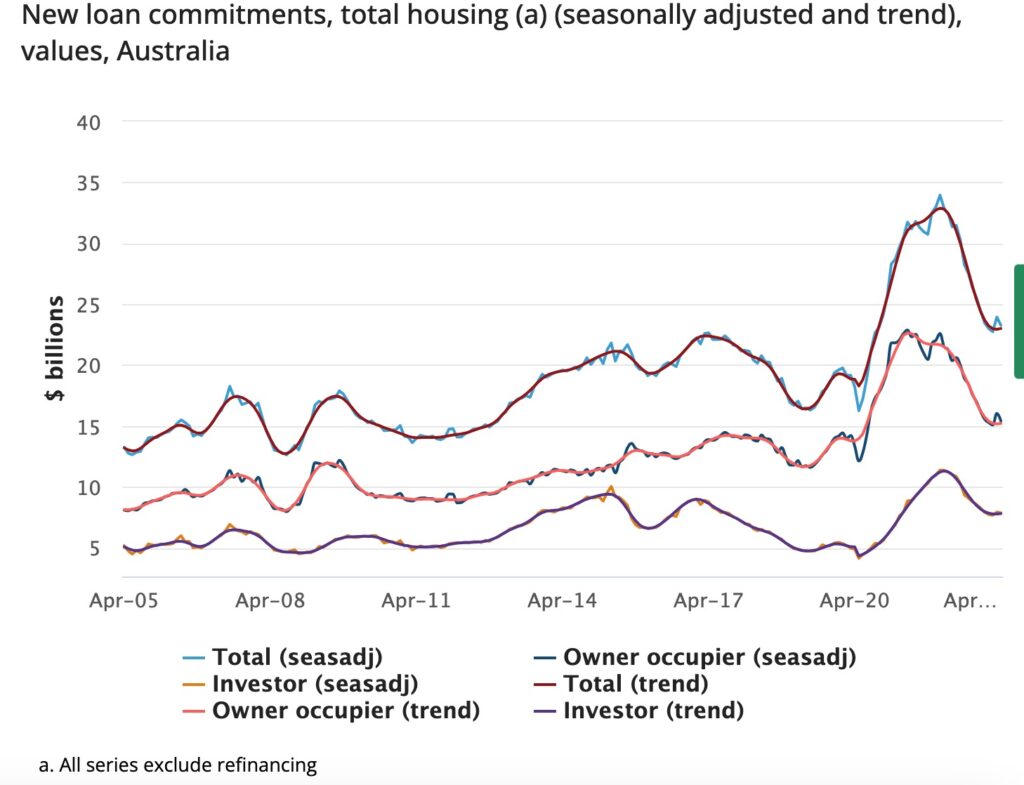
Cate queries the investment loan data and whether these figures could be including vacant (or personal use) dwellings that aren’t actually housing tenants.
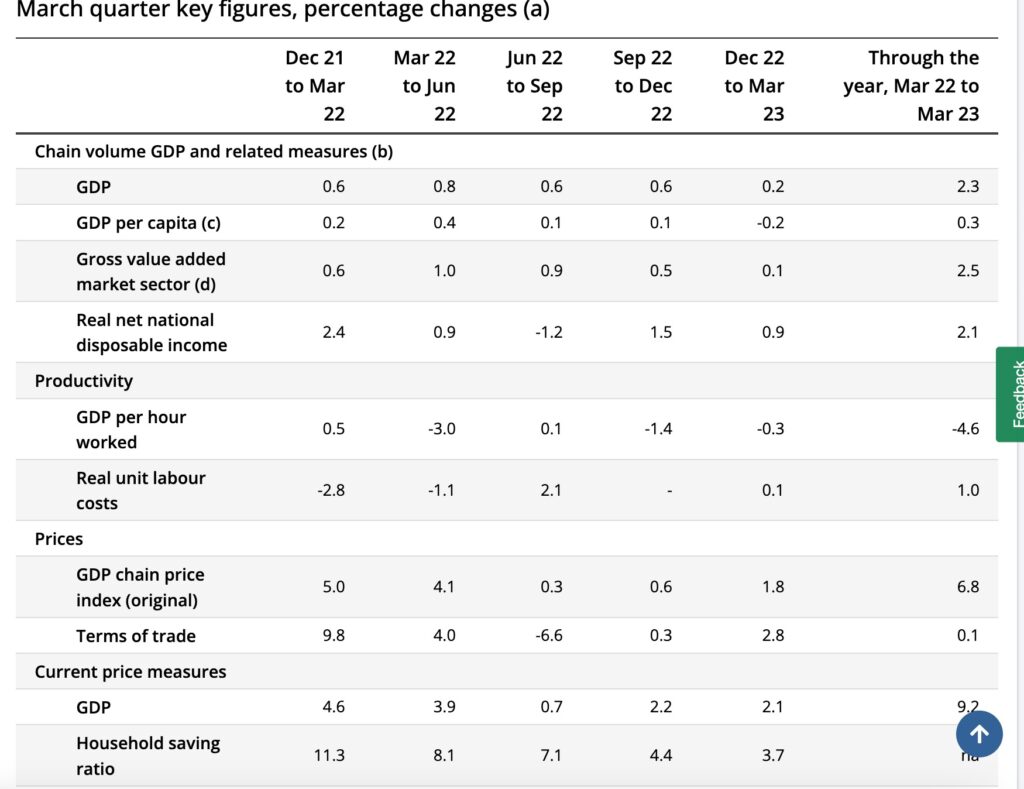
Productivity remains a key concern and stagflation represents a threat to our economy if things don’t improve. Dave details this risk for our listeners.
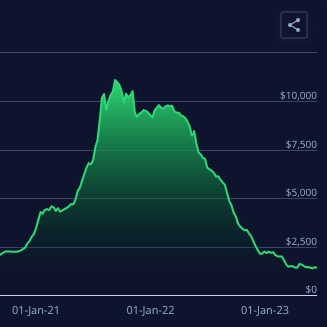
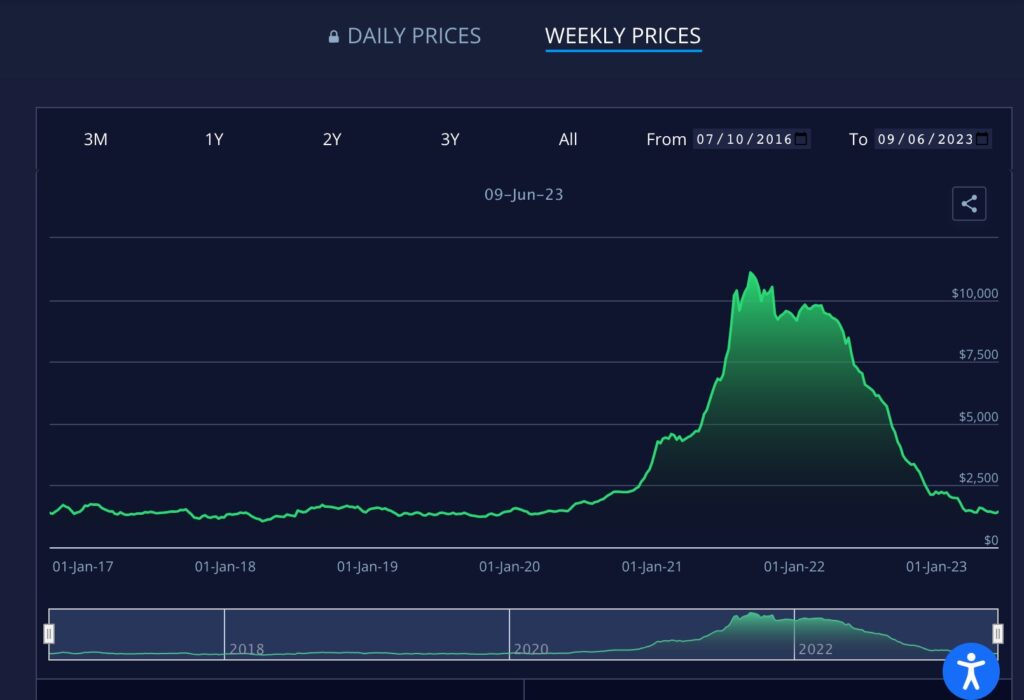
Lastly, our new favourite index, the Freightos Baltic Index is a revealing chart. Freight costs have returned to pre-pandemic levels and this could be a positive beacon for our inflationary problems.
And… time for our gold nuggets…
Dave Johnston’s gold nugget: The breakdown of Goods and Services is an interesting dilemma. With services costs rising but goods settling down, our RBA has their work cut out for them.
Cate Bakos’s gold nugget: Freightos Baltic Index! This is a compelling chart when it comes to gauging the cost of freighting goods; a significant proportion of the overall cost for imported goods.
Mike Mortlock’s gold nugget: When will our spring selling season arrive? Or could listing activity remain low? Mike talks about the challenges buyers face while our supply and demand ratio sits at current levels.
Resources:
If you’ve enjoyed this show, take a listen to these eps:
10 – Why your approach and assessment of risk is paramount to property success!
19 – TIME IN the market v TIMING the market
Blog: Riding the storm

