Ep. 258: Market Update April 24 – Brisbane, Adelaide & Perth Juggernauts Continue, Unit Demand Rises, Federal Budget Rental Relief & Trajectory for Rates
Ep. 258: Market Update April 24 – Brisbane, Adelaide & Perth Juggernauts Continue, Unit Demand Rises, Federal Budget Rental Relief & Trajectory for Rates
Mike kicks off this episode, and directly following Budget Night, the Trio chat all things Federal budget. From the lack of new property initiatives to questioning the impact of the Federal Rental relief, one thing is obvious. The Labour government are acutely aware of the need to see inflation rates reduce, and we are less than one year out from an election. The budget could be described as tame, but that doesn’t slow the discussion at all for the Trio.
April’s increase takes the current growth cycle into its 15th month, with housing values up 11.1% since the trough in January last year.

However, almost every capital city is recording stronger growth conditions across the lower value range of the market.

The shift towards stronger conditions across lower value markets can also be seen between the housing types, with growth in unit values outpacing house values over the past three months. Hobart was the only city where houses recorded a larger gain than units over the past three months.

Regional markets have shown a slightly stronger quarterly growth rate over the past five months than their capital city counterparts, following a 10-month period where the combined capitals index was outperforming. Regional Victoria (-0.1%) was the only rest of state market to record a decline in values over the rolling quarter.
Nationally, rents were up 0.8% in April, a slightly lower rate of growth relative to February and March when the national rental index rose 0.9% and 1.0% respectively.

As Dave points out, Although rental growth may be tapering, supply remains extremely short and the trend towards smaller households seen through COVID has been slow to reverse, further amplifying rental demand. It is likely rental growth will remain well above average for some time yet.

In April, the national gross rental yield rose to 3.75%, the highest reading since October 2019, up from a record low of 3.16% in January 2021.
Vacancies continue to remain tight, although a subtle ease is evident from last month to our current month, with more than half of the capital cities increasing slightly.

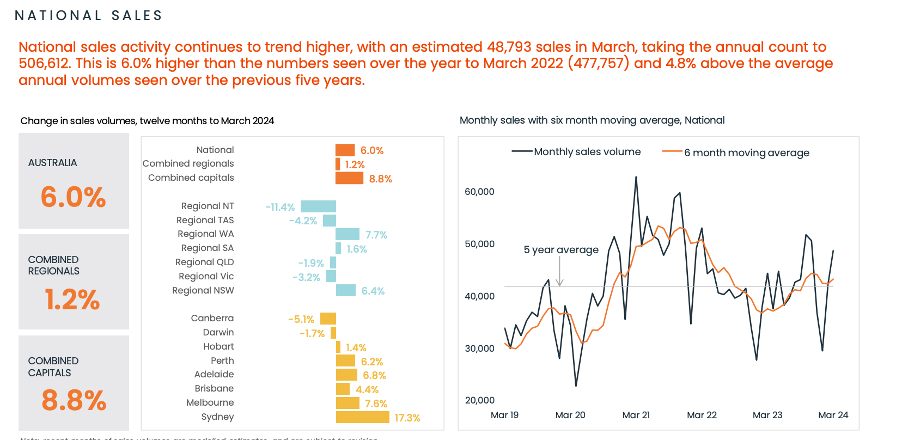
Dwelling sales look to have moved through a cyclical peak in November last year. Although the monthly trend in home sales is highly seasonal, the less seasonal six-month trend has remained relatively flat since the November rate hike.
Estimated sales over the past three months are tracking 8.6% higher than at the same time last year, and about 5.1% above the previous five-year average.

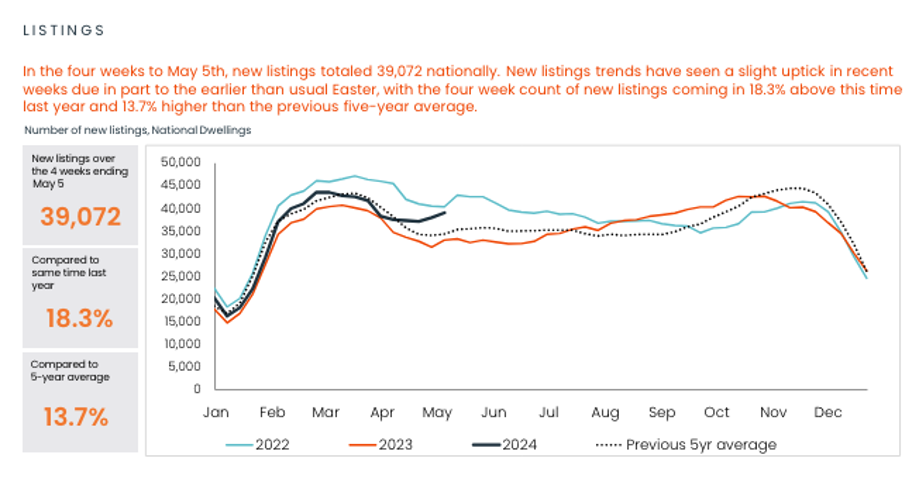
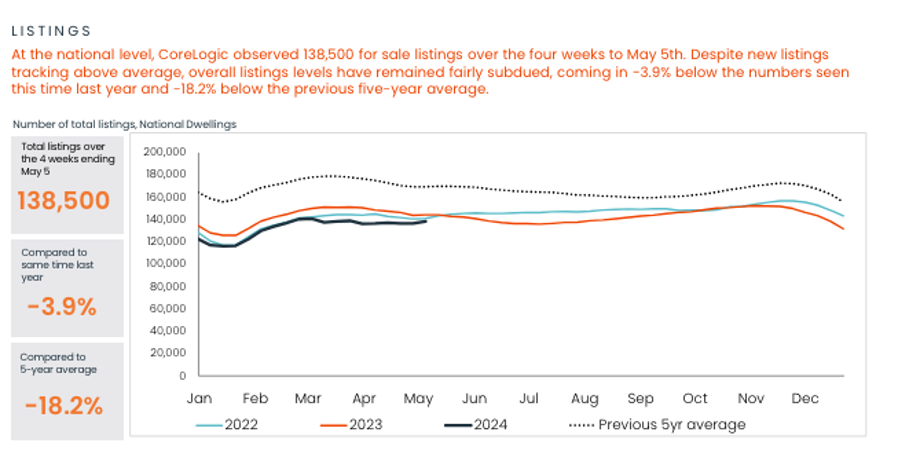
Listing volumes tell an interesting story, and as Cate points out, the rate of new listings is remarkably ‘normal’, in fact it’s slightly stronger than the past five year average. However, the total listings tell another story. Demand is exceeding supply, and older listings are now being snapped up by buyers. The trio canvas what the possible driver could be, and they determine that old stock, (in particular, units) could be the reason. Given the the relative outperformance of units in most capital cities, this possibility doesn’t seem all that extreme.


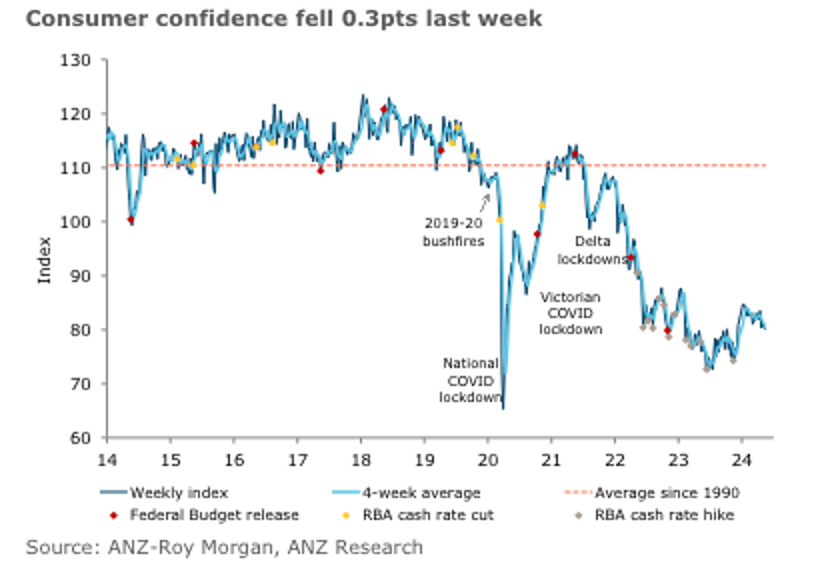
In an effort to cover off the Consumer Sentiment Index, we turned to the ANZ Roy Morgan poll given Westpac’s index is yet to materialise. Consumer Confidence remains very weak, sitting at its lowest level for the year.

And… time for our gold nuggets…
Resources:
If you’ve enjoyed this show, take a listen to these eps:
Here are the ones used:
Ep. 6 – What determines your property strategy?
Ep. 10 – Why your approach and assessment of risk is paramount to property success
Ep. 12 – Property Cycle Management
Ep. 18 – When to hold and when to fold
Ep. 60 – Why established properties out-perform
Charts sourced from Core Logic and SQM Research
And check out Dave’s blog here

