Ep. 284: Market Update Oct 24 – Sentiment Waxes & Wanes but for Which States? Melbourne Yields Make History! Mid-size Capitals Slow & Hobart Rises Again?
Ep. 284: Market Update Oct 24 – Sentiment Waxes & Wanes but for Which States? Melbourne Yields Make History! Mid-size Capitals Slow & Hobart Rises Again?
Cate kicks off this episode with Dave while Mike hikes around New Zealand.
The Duo note some of the interesting indices for the state of the nation in the month of October. They marvel at Hobart’s quick pivot and wonder what has driven the positive growth. The combined regions outperformed the combined capitals too, and despite the strong monthly performance in Perth, they note that growth has slowed of late.
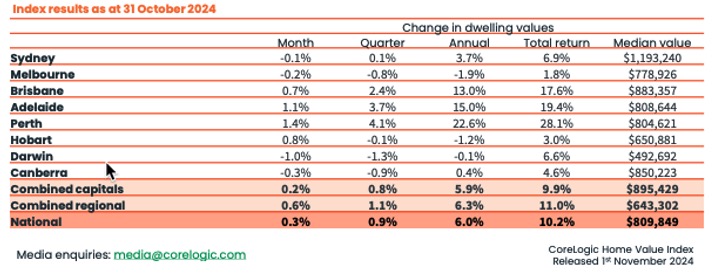
Dave and Cate delve into reluctant-seller psychology. After the high’s of 2021 for the eastern states, and observing Perth’s stellar run over the past couple of years, it’s interesting to consider what behaviours are exhibited when locations experience downturns following a strong run.
Dave notes that consumer sentiment data is suggesting many have a keen eye on Melbourne, and Cate shares some observations about the regional performance in Victoria.
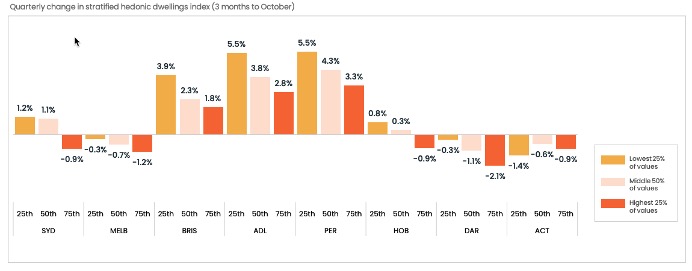
Segmenting the market into price quartiles tells quite a story. Cate and Dave use some examples in the market and they canvas the reasons why the various price points have performed so differently to each other.
Rents remain steady, and aside from Hobart, the pace of growth has slowed. However, vacancy rates remain very tight and yields have strengthened. Dave points out that this combination of data is a leading indicator for value growth.
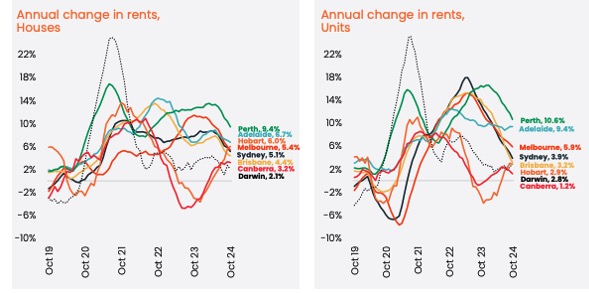
Perth’s downward trajectory over the past few months is quite obvious, but what could be driving Hobart’s rent? Could it be an increase in short-stay dwellings? Has domestic travel to the Apple Isle increased? Or could it be related to the weather? The Duo mull it over…
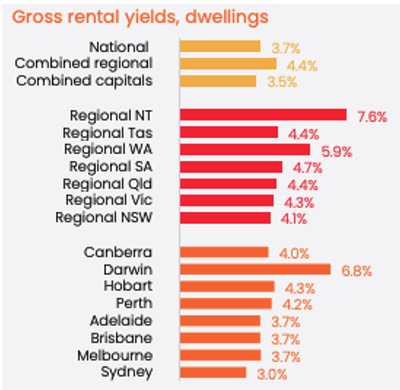
Core Logic’s chart of the month:
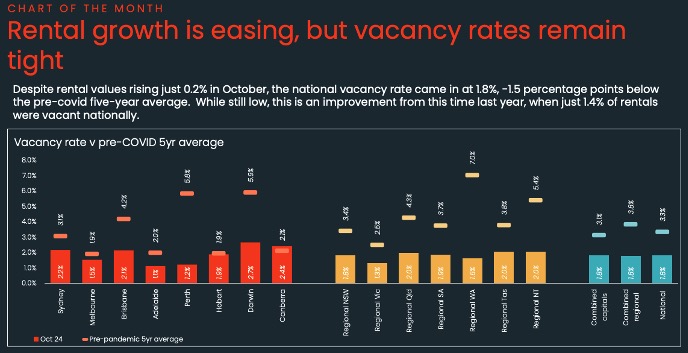
The correlation between capital growth and listing activity is one of the Trio’s favourite discussion points each month. Although Dave makes an important point.
“One of the issues with a five year average is that it doesn’t factor in population growth.”
What’s driving listing activity around the nation? Tune in to find out….
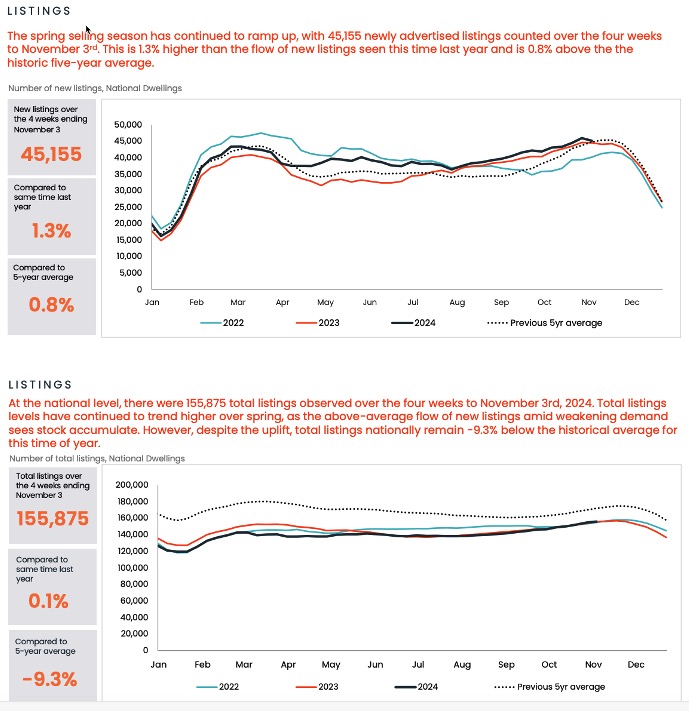
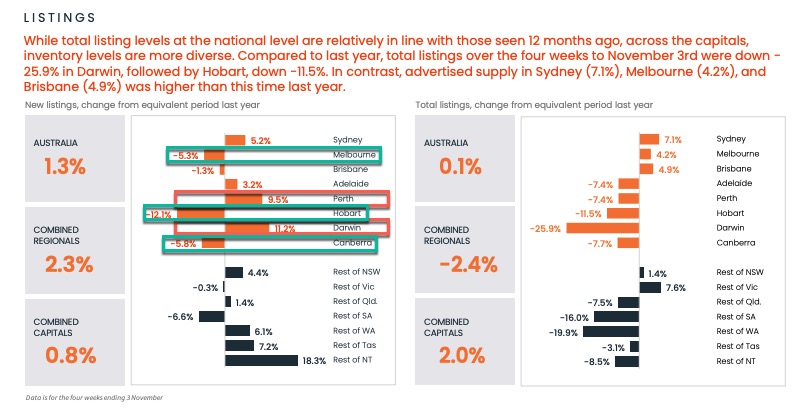
New listing activity has pivoted and Melbourne, Hobart and Canberra listing activity has dropped compared to this time, last year. On the flip-side, Perth and Darwin are exhibiting higher numbers of new listings.
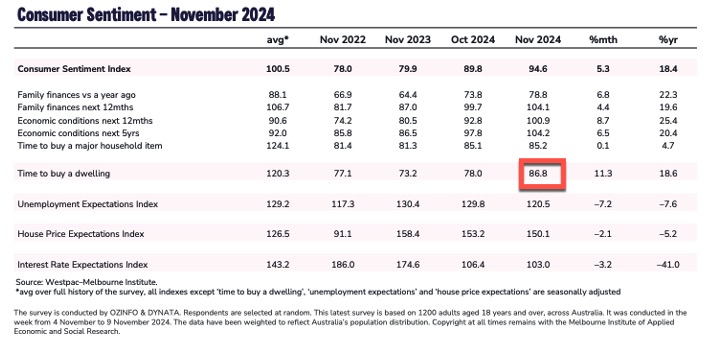
The consumer sentiment index shows a marked increase in the “Time to Buy a Dwelling) measure, and Dave breaks down the data by state. Victoria’s measure is now over 100, a 31.5% increase, while Western Australia’s measure dropped to 66. Dave points out the potential price signals in combination with listing activity.
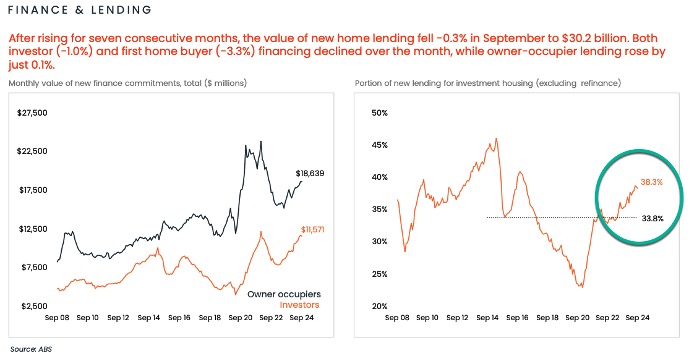
Investors are moving back in to the market at a higher rate and lending has remained steady accross the board.
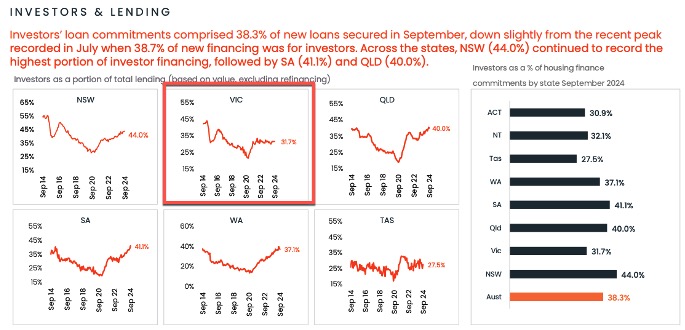
Victoria has underperformed on the investment lending front, unsurprisingly. NSW leads the chase with 44% of new loans secured in September.
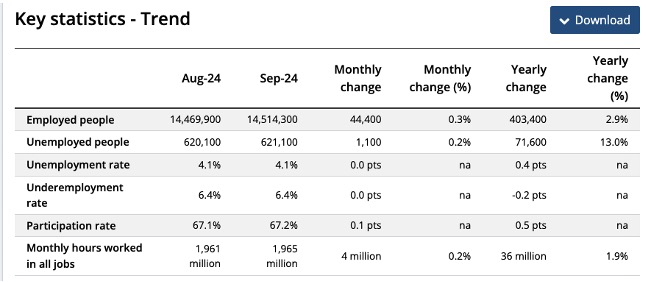
Monthly change of employed people jumped 44,000; a figure that eclipses what many would have expected. Our unemployment rate remains steady despite fears of job-losses as coined by the RBA.
And… time for our gold nuggets…
Cate Bakos’s gold nugget: The new listing activity for 2024 campaigns is easing and there is only realistically another fortnight to run before campaigns finish and the market goes into hibernation over the Christmas period. For any buyers who wanted to purchase in 2024, now is the time! Get out there!
David Johnston’s gold nugget: Make your own decisions based on your own personal economy!
Resources:
14 How to choose a location for investment – what to look for and what to avoid
Charts sourced from Core Logic, ABS and SQM

