


Ep. 300: A Deep Dive into Market Movements Over 6 Years & 300 Episodes – How This Compares to the Last Decade & What Lies Ahead
Ep. 300: A Deep Dive into Market Movements Over 6 Years & 300 Episodes – How This Compares to the Last Decade & What Lies Ahead
1.10 – Cate and Dave walk down memory lane and recall the start of the podcast back in 2019.
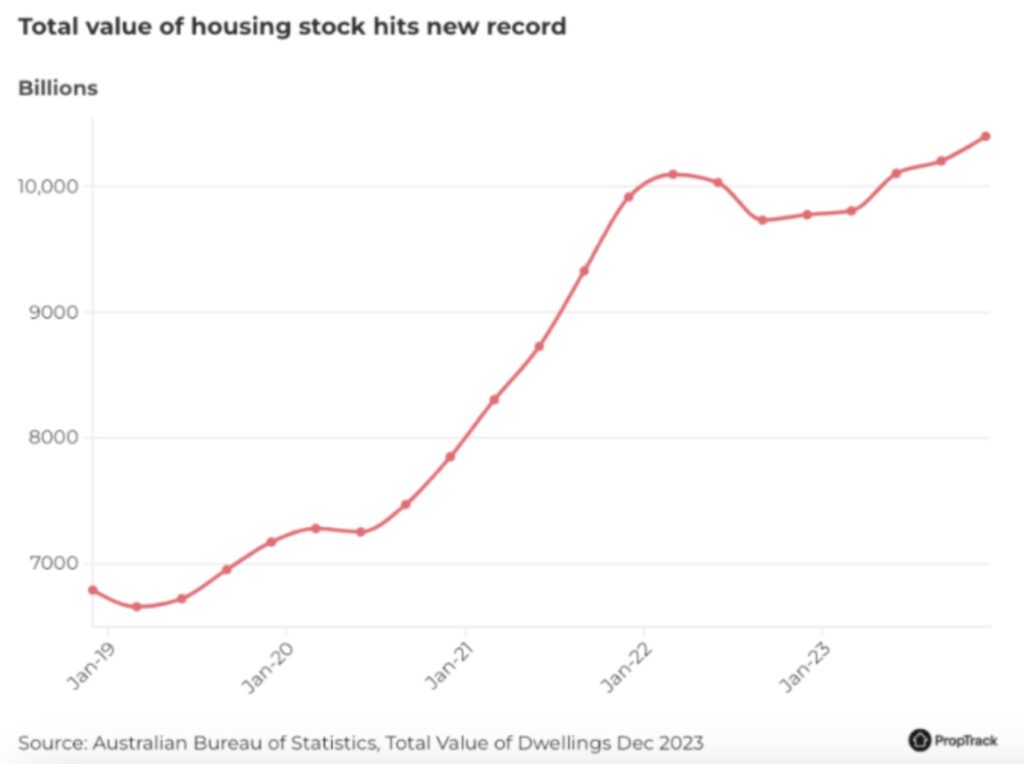
8.48 – Dave shares a startling statistic about the value of Australian residential real estate.
20.30 – Mike calculates the economic impact of an investor outperforming the market by 2%
24.00 – Rental growth was enormous during COVID and following this, our nation sustained some continued rental growth. But what caused this?
34.10 – One of the biggest challenges remains building enough new houses for our growing population
51.54 – Gold nuggets
Dave hosts our 300th show today, and it’s a particularly special episode because we commemorate Mike’s 100th episode in the Trio.
What’s changed in the data, the economy and the Australian property market since we started recording together? They recall the impact of COVID on the studio and the recording setup too.
The first statistic that Dave shares is quite startling. Australian residential real estate has grown from $6.95 trillion dollars to over $11 trillion dollars.
Mike recalls some of the events over the last six years, from recession to home builder initiatives, to COVID and the frightening property forecasts that were thrown around…. and not to mention the toilet paper supply chain debacle.
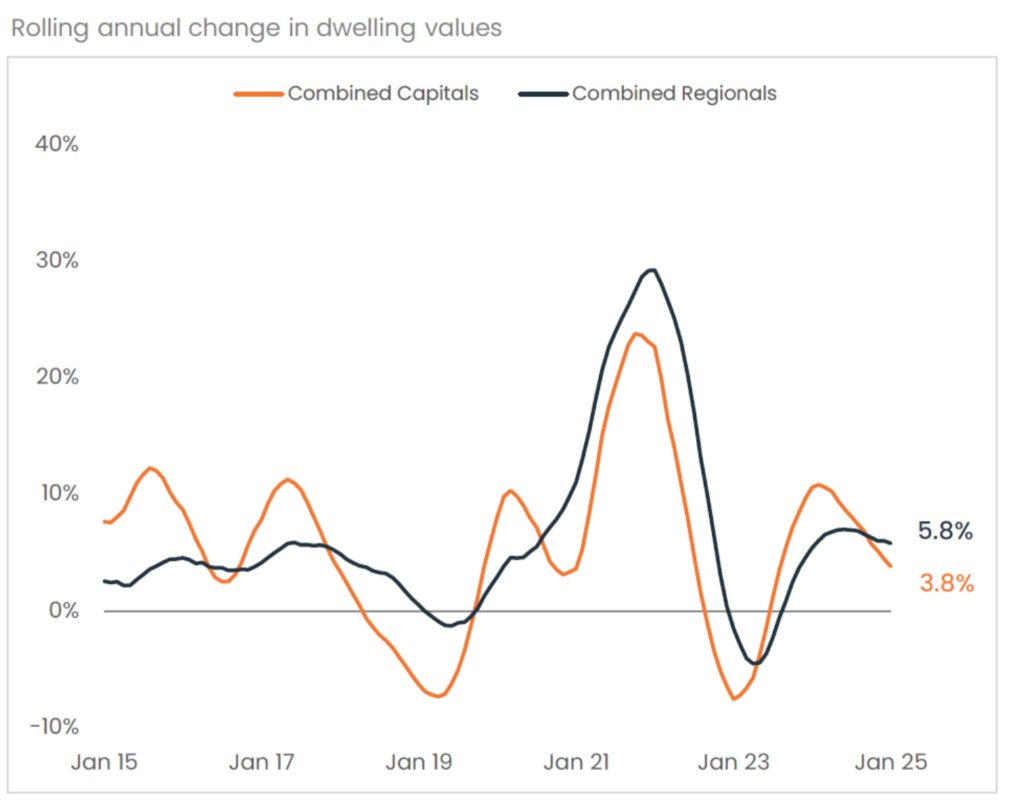
Capital city versus regional city performance is noteworthy. Cate reflects on the pattern that emerged over the recent national market downturns. Post-COVID is an interesting period because the regions have continued to outperform.
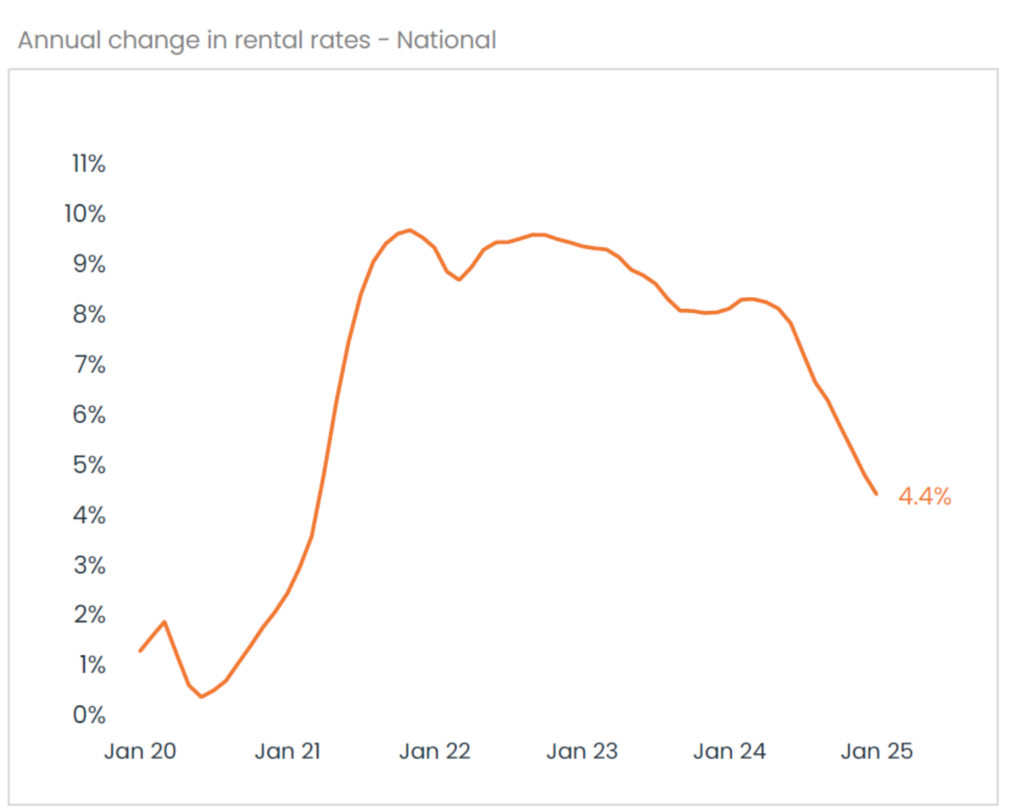
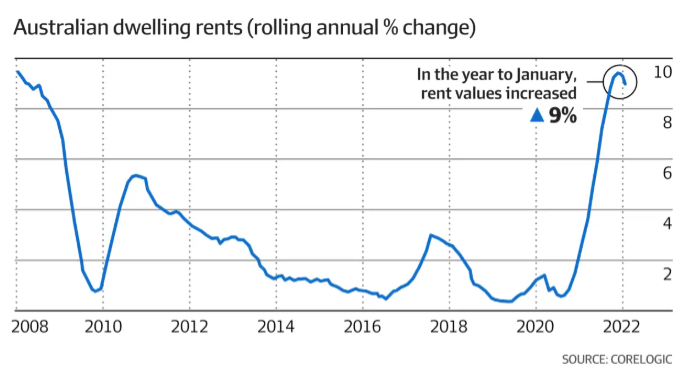
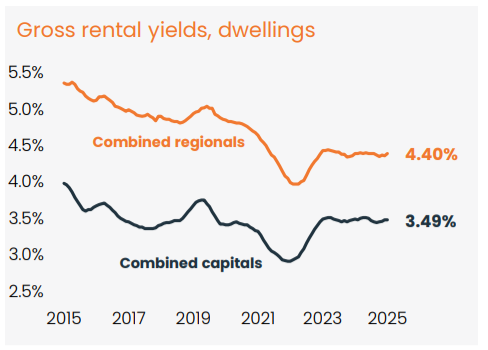
Rental growth over the last five years has outstripped recent historical levels. The Trio step through some of the contributing economic, legislative and social factors that contributed to this. They also consider the impact on rental yields across the nation.
Mike recalls the 33% increase in the material price inputs, global supply chain woes and he cites the Freightos Baltic index peaks during the latter stages of COVID. The construction industry remains the highest for insolvencies in the country though, and Mike considers the impact on the government’s housing accord targets. And Mike shares some interesting data on domestic renovations.
Cate considers the impact of the trade shortage on the market conditions for the various market segments, and she notes the two speed market for renovated vs unrenovated products.
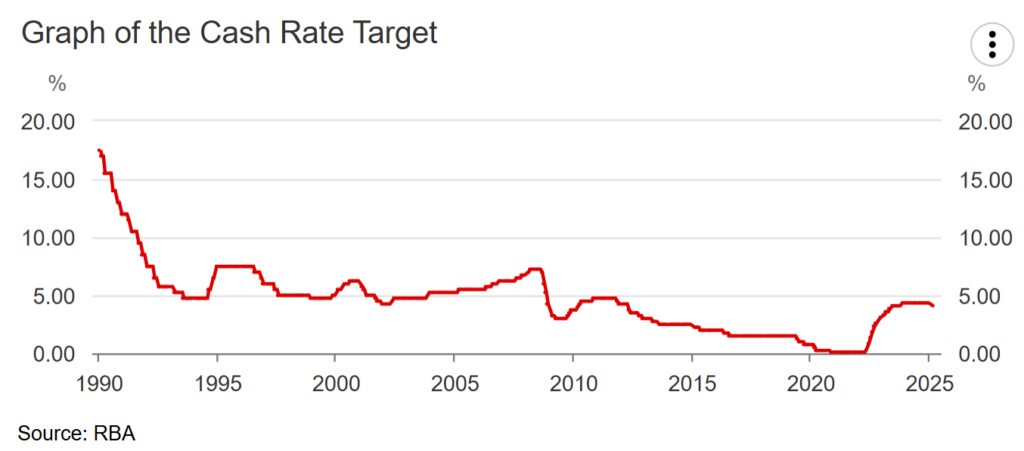
The Trio chat about the cash rate moves over this period and some of the unprecedented changes that resulted and Dave sheds light on some of the fixed rate trends he’s observed, including an insight into buyer behaviours.
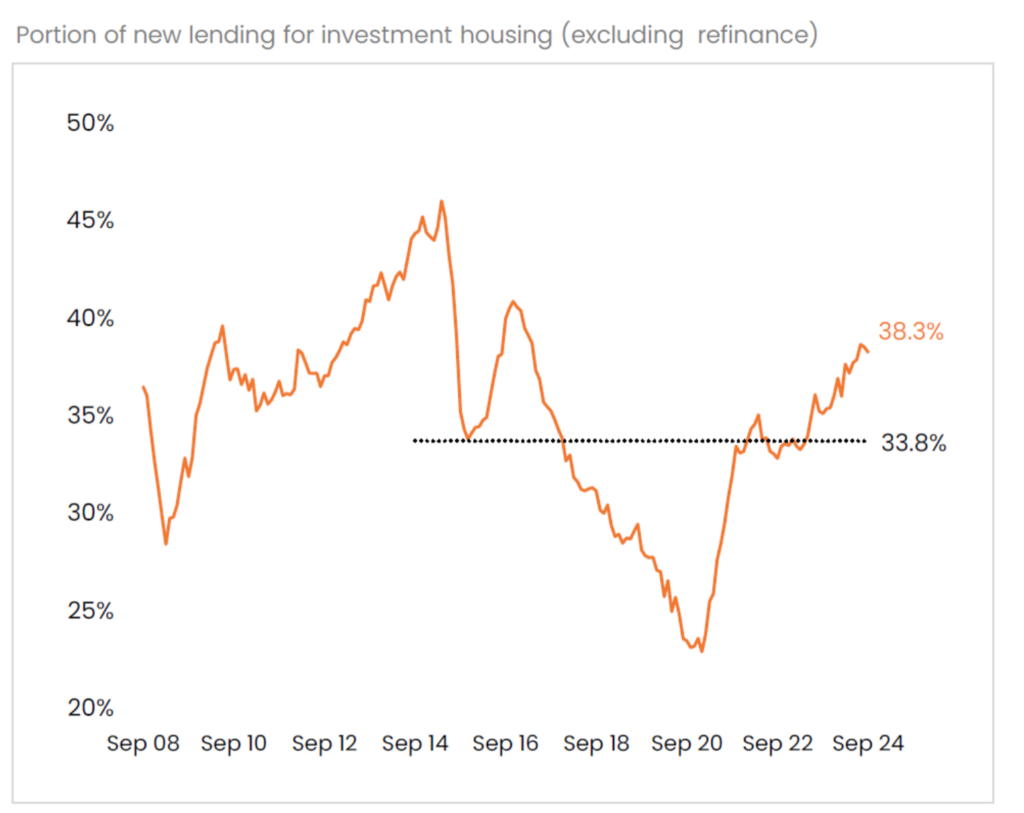
“This chart is a perfect reflection of credit policy!”, Cate says.
Dave walks our listeners through some of the historical interventions into credit supply, and how this has impacted our markets over the years.
Thank you to our listeners. We’ve loved recording these last 300 episodes for you!
Resources:
Australia’s Property Market: 6 Years of Change & What Lies Ahead
Related episodes –
Ep. 52 Dissecting 10 years of Core Logic data – capital cities & regional areas
Upcoming episode – Ep. 301 The March Monthly Market Udpate